Let’s talk about technical analysis & stops.Technical analysis is not your decision-making process — it’s a tool to help you structure better trading decisions by studying past price movements to anticipate likely future moves.
👉 Every time you look at a chart, you should decide:
✅ Do I want to trade at all?
✅ What’s my entry?
✅ Where’s my st

The best trades require research, then commitment.
Get started for free$0 forever, no credit card needed

Scott "Kidd" PoteetThe unlikely astronaut

Where the world does markets
Join 100 million traders and investors taking the future into their own hands.

Eth $2,500 Resistance — Will Harmonic Pattern Trigger a Rally?Ethereum Stuck at $2,500 Resistance — Will Harmonic Pattern Trigger a Rally to $3,400?
Ethereum has been trading in a prolonged consolidation phase around the $2,500 level — a region that has acted as resistance for several weeks. This extended period of sideways action could signify either accumul

SOLANA Loves THIS Pattern | BULLISHSolana usually increases alongside ETH. Possible because its a big competitor.
We can see SOL follows ETH very closely, with the exception of dipping earlier than ETH by a week:
In the 4h, we see a push to breakout above the neckline resistance:
In the daily timeframe, SOL is just about to br

Is Bitcoin Working Out a New Leg Up? Onchain Data Says It May BeDiamond hands are waving goodbye and institutions are loading up — it’s why Bitcoin may be struggling to break out of its current consolidation range. How long can this accumulation phase continue?
And yes — we look at the trades of the decade — two transactions where each one moved a cool billie

BTC monthly yelling at us for something interesting ?We read daily news about ETF, accumulation by institutes and scarcity in the exchanges, but I recognize something different in the chart based on multiple indicators. Historically, BTC boomed after touching 50 EMA and whenever it is extended it traces back to 50 EMA on monthly chart. As per current

Gold on the Move – Major Resistance Levels to Watch AheadThe current price action looks strong, and if the bullish momentum continues, we have three main target levels in mind.
The first target is $3,380. This is an important level we expect gold to reach soon if the trend continues upward.
If the price breaks above $3,380, the next target is $3,433. Th

Watch me make $125 liveafter a brutal night in the markets looking to recoup from the losses I took and regain my momentum before we close the trading week tomorrow.

BTC POTENTIAL BULLS TRAP IN DEVELOPMENTI am inspecting the 4 hour candle in comparison to the daily chart on BTC and it seem we have all the characteristics of a bulls trap on the chart. If the next 4 hours candle does not close bullish, it will confirm a bulls trap and price will likely pullback into the triangle. So be cautious trading

Gold setup: ascending triangle and Trump’s debt bombGold just formed an ascending triangle, and a breakout could send it $300 higher. In this video, we analyse the new pattern, the key breakout level, and why Trump’s new tax bill and Powell’s potential replacement could spark a major move. Will fundamentals match the technicals? Watch to find out.

EURUSD Sell analysis/ideaThis analysis is based on the 4-hour timeframe and executed using reversal trading and trend formation. complete explanation in the video!

See all editors' picks ideas
Logarithmic Moving Average (LMA) [QuantAlgo]🟢 Overview
The Logarithmic Moving Average (LMA) uses advanced logarithmic weighting to create a dynamic trend-following indicator that prioritizes recent price action while maintaining statistical significance. Unlike traditional moving averages that use linear or exponential weights, this indic

Volumatic Support/Resistance Levels [BigBeluga]🔵 OVERVIEW
A smart volume-powered tool for identifying key support and resistance zones—enhanced with real-time volume histogram fills and high-volume markers.
Volumatic Support/Resistance Levels detects structural levels from swing highs and lows, and wraps them in dynamic histograms that re

True Close – Institutional Trading Sessions (Zeiierman)█ Overview
True Close – Institutional Trading Sessions (Zeiierman) is a professional-grade session mapping tool designed to help traders align with how institutions perceive the market’s true close. Unlike the textbook “daily close” used by retail traders, institutional desks often anchor their

Open Interest Footprint IQ [TradingIQ]Hello Traders!
Th e Open Interest Footprint IQ indicator is an advanced visualization tool designed for cryptocurrency markets. It provides a granular, real-time breakdown of open interest changes across different price levels, allowing traders to see how aggressive market participation is distribu

Zigzag CandlesCan't deny that I am obsessed with zigzags. Been doing some crazy experiments with it and have many more in pipeline. I believe zigzag can be used to derive better trend following methods. Here is an attempt to visualize zigzag as candlesticks. Next steps probably to derive moving average, atr (alth

MathStatisticsKernelFunctionsLibrary "MathStatisticsKernelFunctions"
TODO: add library description here
uniform(distance, bandwidth) Uniform kernel.
Parameters:
distance : float, distance to kernel origin.
bandwidth : float, default=1.0, bandwidth limiter to weight the kernel.
Returns: float.
triangular(distance

MathConstantsLibrary "MathConstants"
Mathematical Constants
E() The number e
Log2E() The number log (e)
Log10E() The number log (e)
Ln2() The number log (2)
Ln10() The number log (10)
LnPi() The number log (pi)
Ln2PiOver2() The number log (2*pi)/2
InvE() The number 1/e
SqrtE() The n

taLibrary "ta"
█ OVERVIEW
This library holds technical analysis functions calculating values for which no Pine built-in exists.
Look first. Then leap.
█ FUNCTIONS
cagr(entryTime, entryPrice, exitTime, exitPrice)
It calculates the "Compound Annual Growth Rate" between two points i

Tape [LucF]█ OVERVIEW
This script prints an ersatz of a trading console's "tape" section to the right of your chart. It displays the time, price and volume of each update of the chart's feed. It also calculates volume delta for the bar. As it calculates from realtime information, it will not display info

Dominance Pie ChartA different type of charting, the pie chart,
here for showing the available dominance on one chart,
together with the total % dominance per ticker and between brackets
the % rise/fall.
Can be used in every timeframe
(It is normal it takes some time to be loaded)
Cheers!

See all indicators and strategies
News didn't load
Looks like that didn't go very well. Let's try again.
Community trends
AAAPL: Updated Outlook and Best Level to BUY/HOLD 70% gains________________________________________
Apple Outlook: July 2025–Q1 2026
After peaking near $200 in late May, Apple (AAPL) remains under correction territory despite pockets of resilience, closing July around $193. The current correction is projected to persist until Q1 2026, as global macro and

COIN long -- currently in Wave 3 of 5 wave advance I've been using Elliott Wave Theory to look at COIN's price action. We seem to be in the middle of Wave 3.
- Wave 1: April 7, 2025 to May 22, 2025
- Wave 2: May 23, 2025 to June 13, 2025 - we pulled back right below the 23.6% Fibonacci retracement level with ~$244 serving as support.
- Wave 3: J

Nike - This is the bottom!💉Nike ( NYSE:NKE ) creates the bottom now:
🔎Analysis summary:
More than four years ago, Nike created its previous all time high. We have been witnessing a downtrend ever since and a correction of about -70%. But with the recent retest of an important horizontal structure and bullish confirmat

Intel Falling Wedge on the Weekly Time Frame.If we can hold and get above the 200 EMA on the weekly time frame then we can target the 0.382.
The main target would be the golden pocxket at 0.618.
The target is $50 located at the 0.786.

Hard to find a "butter" trade than TOST - long at 42.49This is my first actual trade of TOST. No particular bias against it, just haven't traded it before. But looking at its paper results, I wish I had been.
Since the first of the year, it has outperformed QQQ more than 2:1 on a B/H basis, which I always like to see, but don't always get in a trade.

TSLA: short as short can...below 200 certainly worth considering a reentry, but currently not sure if it will stop at 200 of 150.

Time to buy? Too much negative press. Buy in Fear- Updated 7/7Apple has faced prolonged downward pressure from bearish investors. Despite its best efforts and some dips, the stock has steadily maintained a baseline price of 200 USD. The flag pattern required some adjustments along its path to break out, primarily due to geopolitical issues and economic variabl

(NVDA) Long Pre-Market position off of previous support. Should wick down, grab liquidity then continue upwards.

TSLA Long Idea — Buying the Support After News-Driven DipNASDAQ:TSLA price has stabilized near the key $290–291 support zone, a level that has previously triggered rebounds. This presents a solid entry opportunity with limited downside risk.
Context: The recent drop was triggered by headlines involving the U.S. President and Elon Musk. If this was mainly

$1 to $2.70 Swing Pick +150% gain so far in a weekHere is updated chart from what I shared with you past week on NASDAQ:VOR
Awesome runner!

See all stocks ideas
Today
BNEDBarnes & Noble Education, Inc
Actual
—
Estimate
−0.81
USD
Today
FNGRFingerMotion, Inc.
Actual
—
Estimate
—
Today
KALVKalVista Pharmaceuticals, Inc.
Actual
—
Estimate
−0.86
USD
Today
PKEPark Aerospace Corp.
Actual
—
Estimate
—
Today
KRUSKura Sushi USA, Inc.
Actual
—
Estimate
−0.01
USD
Today
P
PENGPenguin Solutions, Inc.
Actual
—
Estimate
0.32
USD
Today
AEHRAehr Test Systems
Actual
—
Estimate
−0.02
USD
Tomorrow
ANGOAngioDynamics, Inc.
Actual
—
Estimate
−0.12
USD
See more events
News didn't load
Looks like that didn't go very well. Let's try again.
Community trends
Bitcoin - Bull Trap! Don't get caught (Buy at 102,909 USD)Bitcoin has been pumping last week, but the problem is that the bulls made a false breakout above the bullish flag / descending channel. We see that the price went above the channel but failed to continue in the uptrend. This is called a false breakout of a pattern or a bull trap. Usually what happe

Is Bitcoin Working Out a New Leg Up? Onchain Data Says It May BeDiamond hands are waving goodbye and institutions are loading up — it’s why Bitcoin may be struggling to break out of its current consolidation range. How long can this accumulation phase continue?
And yes — we look at the trades of the decade — two transactions where each one moved a cool billie
SOLANA Loves THIS Pattern | BULLISHSolana usually increases alongside ETH. Possible because its a big competitor.
We can see SOL follows ETH very closely, with the exception of dipping earlier than ETH by a week:
In the 4h, we see a push to breakout above the neckline resistance:
In the daily timeframe, SOL is just about to br
Bitcoin - Last move down, ready for ATH?Bitcoin is showing clear signs of a corrective move within a broader bullish structure. After forming a second consecutive lower high, price is now pressing downward, creating space for a potential liquidity grab and discount entry. Despite this short-term weakness, the macro narrative remains intac

Eth $2,500 Resistance — Will Harmonic Pattern Trigger a Rally?Ethereum Stuck at $2,500 Resistance — Will Harmonic Pattern Trigger a Rally to $3,400?
Ethereum has been trading in a prolonged consolidation phase around the $2,500 level — a region that has acted as resistance for several weeks. This extended period of sideways action could signify either accumul
Bitcoin - The ultimate breakdown for 2025/2026Welcome to my channel and this analysis. In this analysis I will dive deep in the current Bitcoin’s bullmarket. I will examine charts from the monthly, weekly, daily and 4H charts, and also on chain data. This will be a complete insight in Bitcoin’s price.
------------------------
Monthly timefra

80k BTC On The Move - WHAT It Means 80,000 BTC Wallet Movement (2011 Miner)
• Source: 8 wallets containing 10,000 BTC each — mined in 2011, dormant for 14 years
• Total Value: Over $8.6 billion USD
• Timing: Moved on July 4, 2025 — largest dormant BTC transfer in history
• New Addresses: Funds moved to modern SegWit wallets

BTC: Demand Zone + QML + Trendline Flip = Perfect SETUPHello guys!
BTC is showing signs of a potential bullish reversal, forming a Quasimodo Level (QML) setup inside a valid S&D zone that remains unbroken despite multiple tests.
The downward trendline has been broken and is now acting as support, aligning perfectly with the QML and demand zone. giving

Macro view of BTC - why is nobody talking about this?Looking at the weekly BTC chart, there’s a clear long-term resistance that dates back to 2017 and still hasn’t been broken convincingly. There’s plenty of talk this cycle about Bitcoin hitting 150k, just like there was hype around 100k in 2021.
In 2021, BTC formed a significant resistance, which wa

BTC.D The END GAME ( like AVENGERS ! )Hello Traders 🐺
Before we begin, I’d like to name this idea "The End Game" — just like the Avengers movie! 😄
Because honestly… there’s almost no more room left for BTC Dominance (BTC.D) to go higher — and here’s why:
📉 Bearish Divergences Everywhere:
Whether you’re on the daily, weekly, or even mo

See all crypto ideas
News didn't load
Looks like that didn't go very well. Let's try again.
Lingrid | GOLD Weekly Analysis: Consolidation Within UptrendOANDA:XAUUSD market remain trapped in volatile sideways action within a broad consolidation range, following the recent strong rally. Despite the current noisy price behavior, the underlying longer-term bullish momentum remains intact.
Higher timeframe reveals critical technical levels, with gold

The Unicorn Model: : Guide to ICT’s Best Standalone setup🦄 The ICT Unicorn: The Most Powerful Setup in ICT
Among all the concepts of ICT, the Unicorn setup stands out as the ultimate precision entry model, it’s confluence perfected. Why? Because it merges two of the most potent ideas in ICT theory: Breaker Blocks and Fair Value Gaps into a single zone.

GOLD → Buyers are hesitant due to new tariffsFX:XAUUSD continues its correction phase after updating local highs and breaking through trend resistance. The dollar is making traders nervous...
After rising 2% last week, gold started Monday with a decline to $3,300 amid a stronger dollar due to the risk of new tariffs from Trump, who sent

XAU/USD 3H CHART PATTERNOn this XAUUSD 3-hour chart, price has broken out of the descending channel and is retesting near the 3304 area, aligning with a bullish change of character (CHOCH) zone for a potential buy setup. The chart shows a clear upward projection after the retest, targeting a move towards the upper resistan

GOLD ROUTE MAP UPDATEHey Everyone,
Great start to the week with our levels being respected inline with our plans to buy dips.
We started the week with our bearish target 3330 being hit followed with ema5 cross and lock opening 3306 inline with the retracement range. This was hit perfectly completing the retracement ra

GOLD remains stuck near 3365dGOLD remains stuck near 3365
Price faced a strong resistance zone in the bullish move near 3365
If we look at the left side of the chart, it shows that it could fall further. The structure zone near 3365 seems to be ver.y strong.
As long as the price has not risen above 3392 when Iran attacked th

Setupsfx_ | XAUUSD(Gold):07/07/2025 Update | Gold dropped nicely when the market opened last night, dropping around 600 pips. However, it couldn’t hold on to the gains and came right back to the selling zone. There are two entry points and two potential targets.
Good luck and trade safely!
Team Setupsfx_

SILVER Will Go Lower From Resistance! Short!
Here is our detailed technical review for SILVER.
Time Frame: 12h
Current Trend: Bearish
Sentiment: Overbought (based on 7-period RSI)
Forecast: Bearish
The market is approaching a significant resistance area 3,654.7.
Due to the fact that we see a positive bearish reaction from the underlined ar

THE KOG REPORTTHE KOG REPORT:
In last week’s KOG Report we said we would ideally be looking for price to attempt lower and reject at the red box giving us the opportunity to long back up into the key levels following the red box and Excalibur targets. We did open with a huge spike down, into the 2nd region we w

Gold Finds Supports – Is the Rebound About to Begin?Gold ( OANDA:XAUUSD ) declined to the Support zone($3,312-$3,290) and Support lines as I expected in the previous idea .
Gold is currently trading in the Support zone($3,312-$3,290) and near a set of support lines .
In terms of Elliott Wave theory , it seems that Gold has completed th

See all futures ideas
News didn't load
Looks like that didn't go very well. Let's try again.
USDJPY h4 down Scenario: Break above 146.20
Entry: 146.30
Target: 148.00 / 149.50
SL: 145.40
Invalidation: Only a clean close below 144.50 confirms the bearish setup again

GBP/USD - H1- Bearish Flag (07.07.2025)The GBP/USD Pair on the M30 timeframe presents a Potential Selling Opportunity due to a recent Formation of a Bearish Flag Pattern. This suggests a shift in momentum towards the downside in the coming hours.
Possible Short Trade:
Entry: Consider Entering A Short Position around Trendline Of Th

BULLISH H4 MOMENTUM ACTIVATED...?📊 Pattern & Structure:
The chart shows a downward channel (falling wedge) pattern that has recently been broken to the upside, indicating a bullish breakout.
The breakout is clean, with a sharp upward move, confirming the reversal from the bearish trend.
🔍 Key Levels Identified:
Support Zone:

USDJPY Price Accumulated|Time For Bullish Distribution|Setupsfx|The price has accumulated nicely and is now distributing. We have three targets in mind, but set your own based on your analysis. Our approach is purely technical, but also includes a basic fundamental approach. This analysis concludes over 1500 pips and is a swing move. Please use this analysis as

USD/CAD) Down Trand Read The captionSMC trading point update
Technical analysis of USD/CAD (U.S. Dollar / Canadian Dollar) on the 1-hour timeframe, with a focus on a potential double-top formation at strong resistance, followed by a drop toward support:
---
Analysis Overview
Trend Structure: Downward-sloping channel with low

USDCHF: A Bullish Reversal Hinges on 0.7985USDCHF: A Bullish Reversal Hinges on 0.7985
USDCHF is currently testing a critical support zone near 0.7880—a level not seen since 2011.
The fact that price has returned to this area after more than a decade underscores the significance of this moment.
The pair remains under pressure for two ke

EURNZD: Steep Channel continuation setupEURNZD continues to rise within a steep ascending channel, maintaining a well-structured sequence. No signs of exhaustion are evident yet, as bullish momentum remains strong and price action continues to respect both the midline and lower boundary of the channel.
This ongoing strength suggests that

AUDUSDHello Traders! 👋
What are your thoughts on AUDUSD?
The AUDUSD pair reached a resistance zone, which was accompanied by a negative divergence, signaling weakening bullish momentum. This led to a bearish reaction from that area.
We expect that, after some consolidation around this resistance, the pa

EURO - Price can continue to grow inside rising channelHi guys, this is my overview for EURUSD, feel free to check it and write your feedback in comments👊
The price traded in a flat range between $1.1500 and $1.1750 for an extended period, testing both extremes multiple times with low volatility and indecision.
A breakout above $1.1750 initially looke

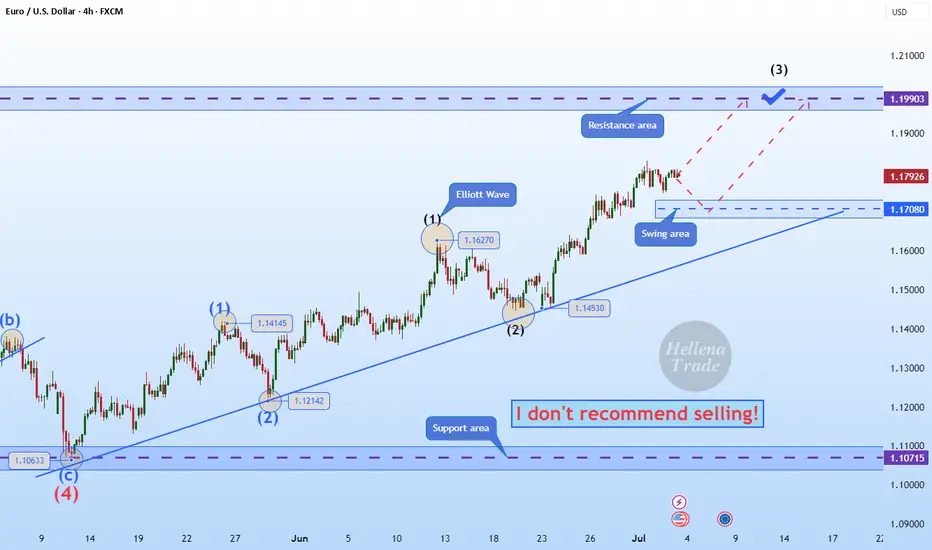
Hellena | EUR/USD (4H): LONG to the resistance area 1.20000.Colleagues, I believe that the upward impulse is not over yet. Wave “3” of the higher order and wave “3” of the lower order are just completing their movement, and I think that at the moment it is worth looking at the resistance area of 1.20000.
This is a very attractive psychological level where wa
See all forex ideas
| - | - | - | - | - | - | - | ||
| - | - | - | - | - | - | - | ||
| - | - | - | - | - | - | - | ||
| - | - | - | - | - | - | - | ||
| - | - | - | - | - | - | - | ||
| - | - | - | - | - | - | - | ||
| - | - | - | - | - | - | - | ||
| - | - | - | - | - | - | - |
News didn't load
Looks like that didn't go very well. Let's try again.
Trade directly on the supercharts through our supported, fully-verified and user-reviewed brokers.


