ATAS
Advanced Trading Analytical Software
ATAS Ltd.
DDH+TinyURL:
ddh.plus/en/b/atas
Advanced Trading Analytical Software
ATAS Ltd.
Address
ATAS Ltd.
1 Katlakalna str.
Riga
Latvia
LV-1073
VAT No. LV40203154738
Reg.Nr: 40203154738
Reg.Nr: 40203154738
This service is available in English, German, Spanish, and French language
ADVANCED TRADING ANALYTICAL SOFTWARE®
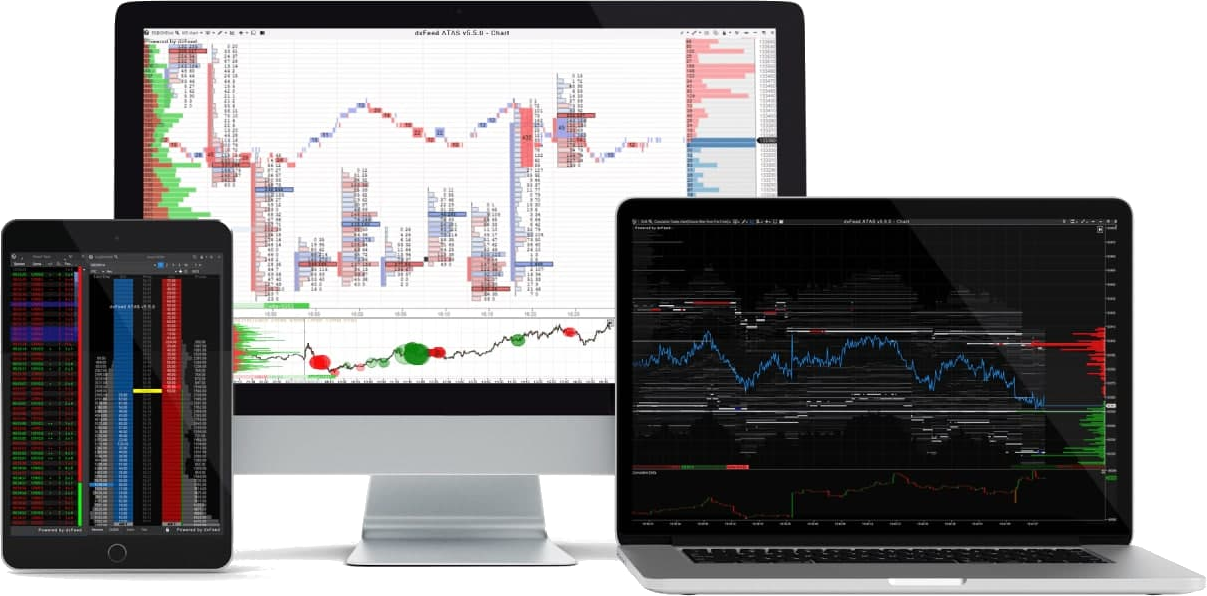
 ATAS specializes in order flow analysis, cluster analysis, volume market profile and advanced technical analysis.
A powerful combination of analytical tools increases market transparency, allowing traders to react quickly and make trade decisions effectively.
Our platform is used by proprietary trading companies and professional traders throughout the world.
A quick and simple connection to such popular data providers as Rithmic, CQG/Continuum, dxFeed, T4 (CTS), TT, IQfeed, Interactive Brokers, Plaza II, Quik with the possibility to trade through Rithmic, CQG/Continuum, T4 (CTS), TT, Interactive Brokers, Plaza II and Quik is enabled.
We keep working on including more data service providers for even better user experience!
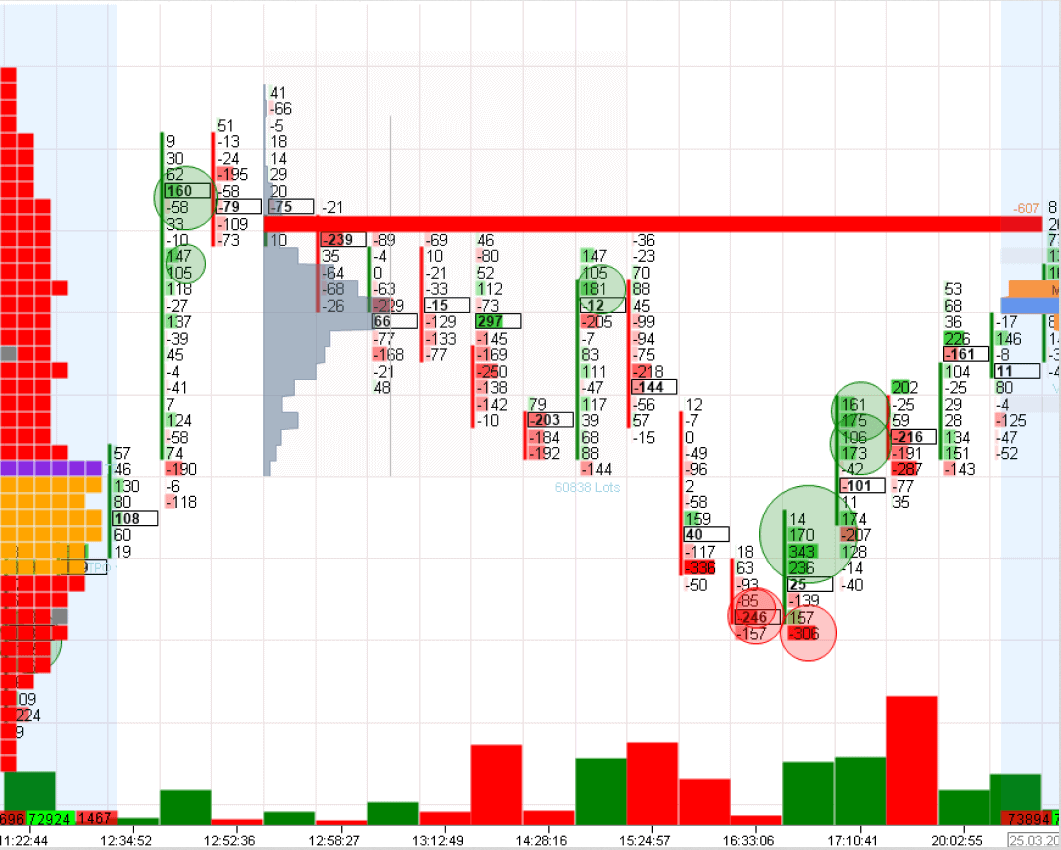
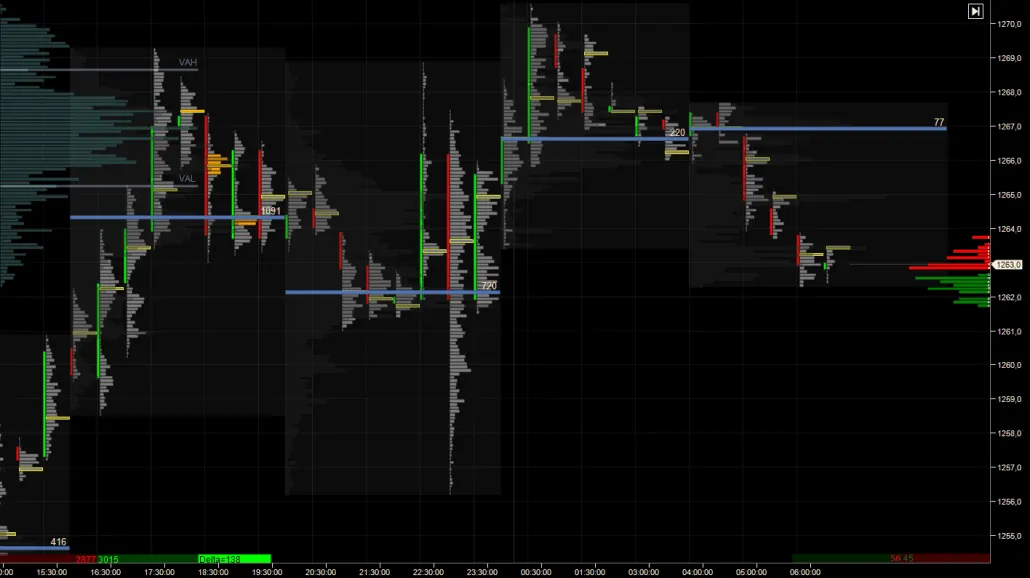
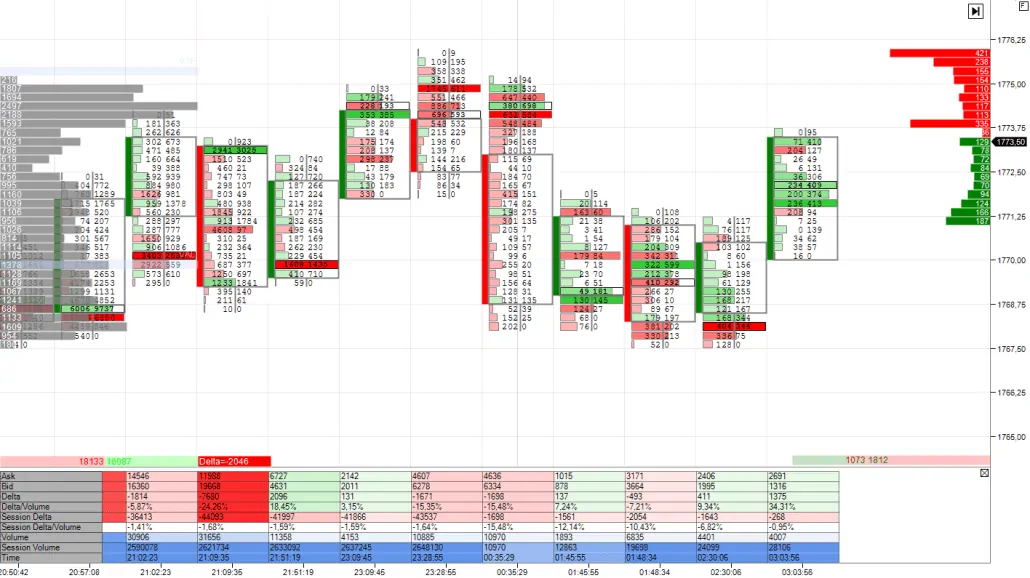
VOLUME ANALYSIS
There’s much more than just charts. Visual analysis of order flow, cluster analysis, volume profile of market, etc. allow viewing the market from the inside and realizing its motivation.

MARKETS
Possibility to Analyze & Trade US (futures/stocks) and Russian (futures/stocks) markets
TIME FRAMES
Alternative time frames of charts: seconds, tick, reversal, range, volume, delta…
FILTERS
Unique set of filters and indicators shows the most current market situation
HISTORY
Analysis of historical data (every tick, every trade) with possibility to link Print Tape to a chart. There are also continuous contracts for analysis at long time periods available.
SMART TAPE
Our version of tape (Smart Tape), combines individual prints back together (the way it used to be before 2009) so that you can easily see the actual market orders to their full extent. There are also filters available in the Smart Tape so you easily sense what the bigger/smaller traders are doing at the moment.
CHARTS
- Construction of tick, one-minute and RangeX charts
- Clustering of data. Each bar can be viewed “from the inside” (it can be seen what volumes, bids, asks, deltas were on each price of the given bar)
- Linked windows creation. Any of the modules mentioned above can be created using the chart. The counters, at that, are linked to the chart.
- History viewing. If linked windows were created, any bars in which you want to view data can be marked in the chart. When specifying the interval, information for the marked range will be displayed in linked windows. This makes testing ideas using history very simple and convenient.
- Display of large market spikes in the chart. It is possible to create any number of filters for orders which will be displayed in the charts. (BigTrades Indicator)
- Bar chart of volumes with the possibility to choose initial and finite interval (display options: Volume, Trades, Bid-Ask, Delta, Icebergs).
- A whole range of innovative indicators allowing transformation of order flow into a comprehensible form, easy and clear for visual perception.
SMART DOM
This innovative tool designed to spot and analize activity of high friquency algorithms – HFTs.
It allows you:
- To highlight large orders
- To spot activities of spoofing algorithmes
Spoofing algos mostly designed to mislead you. For example a spoofing algo makes an order visible in the DOM for 9/10 of a second then within 1/10 of a second removes it from the DOM and puts it back on. It’s difficult for human eyes to sense these changes, therefore, it creates an impression of a big order.
TRADING
User-friendly trading and position management both via the Trading DOM and directly from the chart (Chart Trader)
Test now free of charge